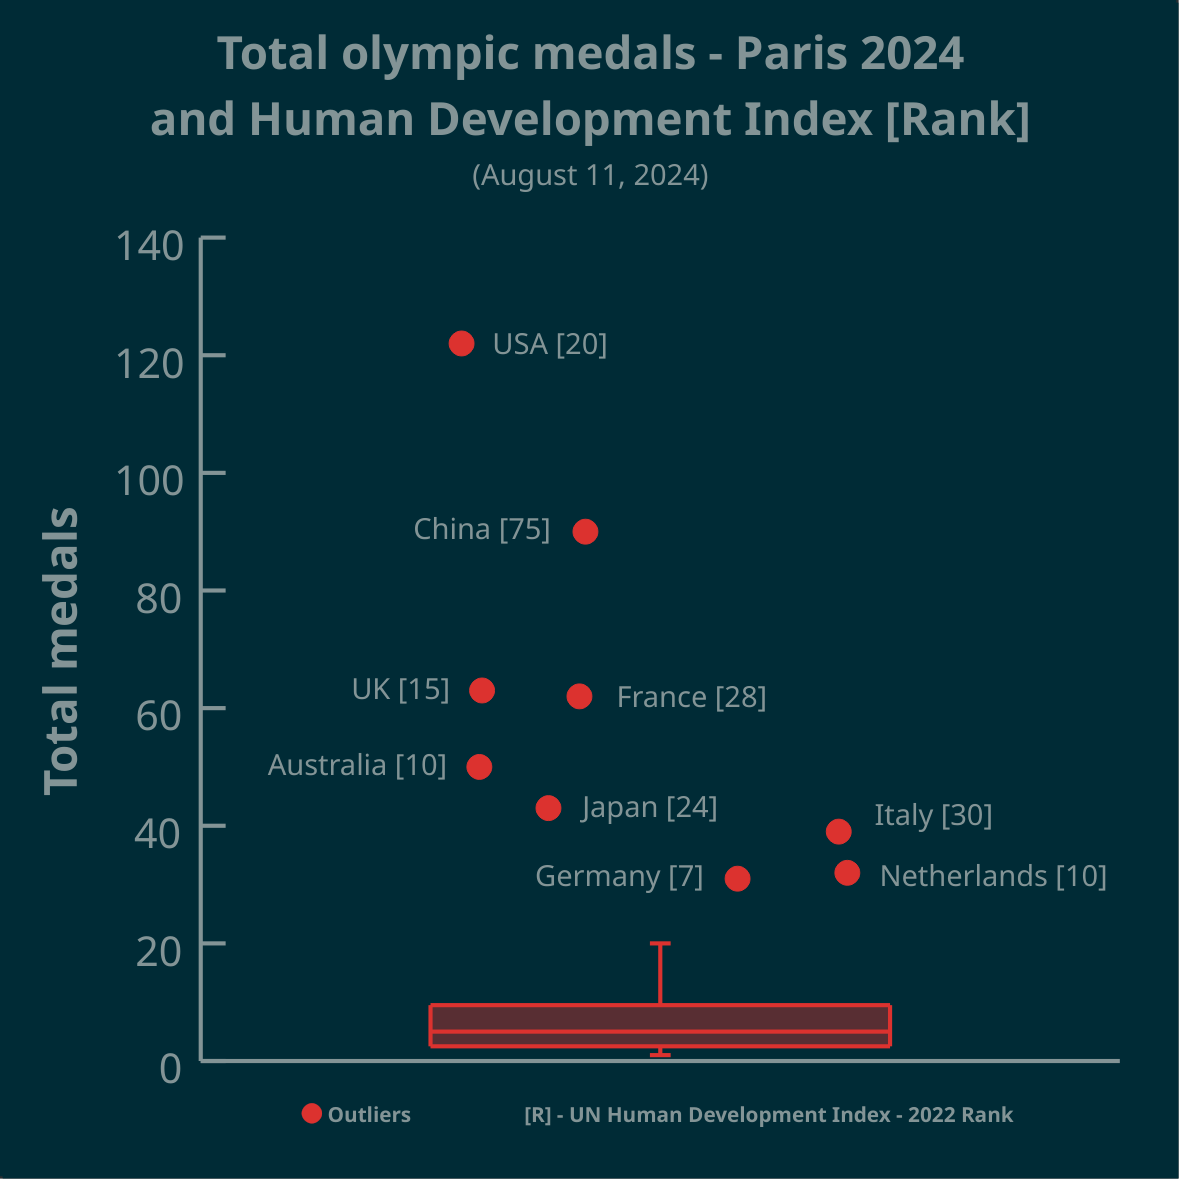
▶️ Total olympic medals won in Paris 2024 and Human Development Index 🏅
➡️ https://www.businesstimes.com.sg/opinion-features/what-olympic-medal-table-really-tells-us
After reading the article we made this #boxplot using #LabPlot, an open source data analysis and visualization software.
The plot doesn’t provide answers, it rather invites some thinking.
#Olympics #Olympics2024 #France #China #USA #UnitedStates #UnitedKingdom #UK #Brazil #Australia #Japan #Italy #Canada #Germany #Italy #Netherlands #DataAnalysis #DataScience #OpenSource #FOSS
OP has tagged Canada but it’s not shown in the plot.
@StillPaisleyCat
Only the names of outliers* have been displayed. South Korea and Canada are not outliers, but they are right after Germany, as you can see in this new plot (to avoid over-plotting Netherlands and Germany are not shown).
* the values lying beyond the value that is 3 times the IQR (the interquartile range) above the Q3 (the third quartile)