

- cross-posted to:
- memes@lemmy.ml
- cross-posted to:
- memes@lemmy.ml
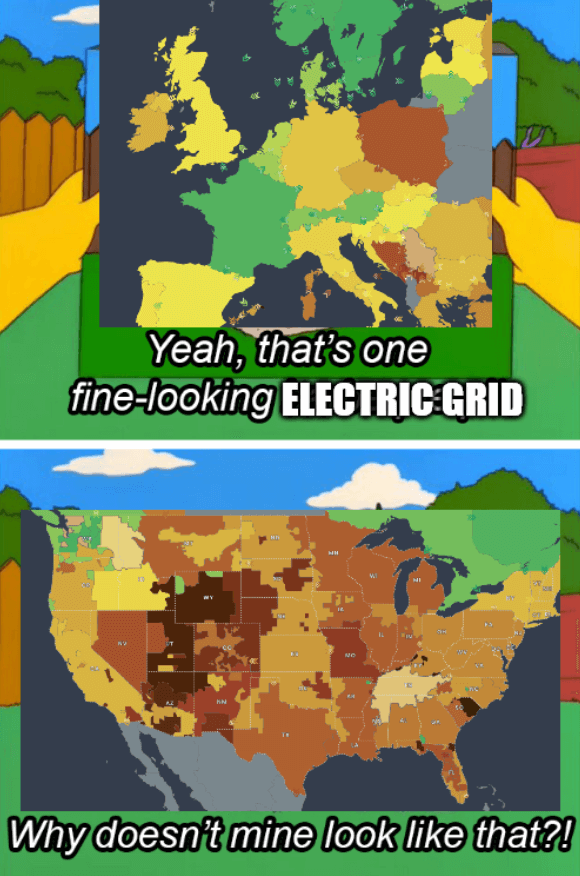
Source - The colors of the grids represent CO2 emissions
The title is a reference to the 2021 Texas power crisis
Source - The colors of the grids represent CO2 emissions
The title is a reference to the 2021 Texas power crisis
This map underrepresents emissions from NPPs. The emissions that are assumed for nuclear are lower than everything you find in literature and are 1/5th to 1/10th of what reputable sources state. That being said, this map is otherwise a great resource and i like it very much.
Really? Because they use the figure given by UNECE, that’s a pretty good source I feel? The report it comes from is also very thorough.
What sources have you seen that state a number 10 times higher? Would be interesting to see where the difference is and what numbers they give for other sources.
It will take some time but I will answer with sources. Can you post the source used in the map i have never been able to find anything that came close.
Sure! This is the report: https://unece.org/sites/default/files/2022-04/LCA_3_FINAL March 2022.pdf
It has a description of the methods and the ISO standards they use to determine life-cycle CO2, from the cradle to the grave numbers. It also includes all the references and sources. I’m sure there’s a lot more info available about the research they did, but this is the high-level report.
The UN seems like a pretty reliable source and the report seems very thorough, but I’m not qualified to say where they went wrong. So I would love to see what other sources say on the subject.
Edit: They even state in their report why the value they give for nuclear is on the low end of most accepted literature:
But even if you double the amount, it’s still the best or at least one of the best.