I’m not young, but I feel the same way as these young people. I don’t care about this country, I don’t care about its people, and I don’t care about its future. It’s like that Bob Dylan song, “I used to care, but things have changed.”
I care about its people. I always care about people. Just some people need to be rescued from their hate filled delusion. It’s sad to see these poor suckers get tricked into being angry about things that have absolutely nothing to do with them. Talking about conservative media and how all it does is lash out against things. I don’t even think there is ryhme or reason to it. It is as if they offer up a topic and open the floor to anyone who has some minor complaint.
Another one of those frustrating segments where they come so close to being right but miss the point entirely by the end. The diagnosis of the issues young people face is on point, but the answer to most of the problems mentioned is not civics courses. It’s redistribution of wealth and providing access to housing and social mobility to young people.
but the answer to most of the problems mentioned is not civics courses
Civics courses are necessary precursors. A lot of youthful idiots think Biden has a big “cancel student loans” button on his bedside table and just chooses not to push it because lmao fuck those guys, make em pay
You can’t pursue solutions if you don’t know how.
Yeah it’s easy to demand things, it’s hard to accept mutual responsibility and contribute. It’s the difference between demanding mutual aid, and actually showing up
There are 38 US companies whose gross yearly revenue is over $100 billion. The collective amount OVER $100 billion is about the same as the US federal budget. No company should make more than $100 billion in revenue - it’s a monopolistic action. Tax all corporate revenue over $100 billion. How much is a variable amount based upon federal deficit spending. If the US government overspends $1 trillion then that amount is paid by these too large corporations. That way US politicians are disincentivized to over spend as the largest corporations will lobby strongly to have a balanced budget. If all US companies downsize or split off to reduce revenue to <$100 billion? Awesome, then we have no monopolies and their lobbying powers are therefore greatly diminished.
Revenue is not profit. Costs haven’t been taken out yet. This is part of the structural unfairness of personal income tax vs corporate income tax. Companies can write off everything they need to earn money (rent, supplies, wages, utilities) but people can’t.
How many companies have $100 million in profit, or more? It’s just one: Apple.
https://www.financecharts.com/screener/most-profitable-country-us
They’re already under investigation for monopoly practices:
https://www.nytimes.com/2024/03/21/technology/apple-doj-lawsuit-antitrust.html
If they didn’t count expansion and buying property and tools with reliable resell values as “costs” I’d agree.
Businesses can’t deduct those asset purchases as costs (they are not “expenses”). They have to depreciate them over a set number of years, according to established accounting practices.
Purchases of long-term business assets, such as factories and equipment, are claimed as depreciation. This involves subtracting a percentage of their cost per tax return over a period of years.
https://www.thebalancemoney.com/expense-or-depreciate-items-on-your-taxes-392950
This is fine and actually correct, because equipment and buildings literally cost money every year to repair or replace parts.
There are enough things to be angry about without making anything up. Please educate yourself about what businesses actually do, so you can advocate correctly. Otherwise you just sound dumb.
Lol, sucker
I don’t care of costs haven’t been taken out. Tax it at some low rate (ie 1-5%). Again, no company should revenue >$100 billion/year anyway because, as you’ve stated, it’s pretty much a monopoly at that point.
What is to opt into? It’s barely affordable to live.
It puts the decision on the oppressed because the system is infallible.
deleted by creator
Come to California, learn a skilled trade, it’s pretty cool dude.
We have every right to be pissed off. I followed every rule you’re supposed to follow. And I’m still worried about retiring in the future. The system is fucking stupid. At my job, every system I implement or touch can be changed. Change is a part of life. But for some fucking reason, this country can’t change shit. We just sit in it as everything gets worse while everyone who is struggling continues to struggle even more. The rich get richer. America blows.
We just sit in it as everything gets worse
Democrats make things better. Vote more democrats in, more things get more better.
For example, under Biden, the wealth gap between the poorest and the richest is now closing for the first time in almost 100 years. Yes, that’s cold comfort to the middle class, but it shouldn’t be. It’s the start of a trend and we need to see it through.
As long as you’re not a child in Palestine
It’s like r/onejoke but for agent provacateurs
Or like when Lois just says “9/11” over and over again and gets elected
Fuck me for caring, right? Nothing to see here. Move along.
Inb4 Hurr durr if you don’t like it leave
If you don’t like it, vote.
I’ve voted in every local and national election as soon as I turned 18. Protested in George Floyd protests. I’m 30 now. Shit takes way too long.
Protesting is for you to feel good. Unless you’re protesting for civil rights and being arrested for breaking an unjust law.
If you want to influence the process, you should volunteer for a candidate’s campaign and forget protests. Sorry, but it’s the truth.
While I generally agree with you, protesting has a place. Protesting alone is useless, but protests in concert with working for concrete policy changes is a force multiplier.
deleted by creator
I live in a formerly purple county, one of the wealthiest in the nation, that the Democrats have entirely abandoned despite being able to win local elections.
The only reason I have any choice at all most of the time is that I know I can choose to leave my votes for local offices blank.
What have you done about that?
Assassinated Trump. He’s actually getting Weekend at Bernie’s’d rn, but shush, my militia is going to expose it in October
If my fiance could work outside the US, we would have left a few years ago.
Why can’t they?
Professional certifications don’t transfer outside specific countries, and her profession is also very language-oriented so she would have to be absolutely fluent in the language of whatever country we went to. That basically leaves England, New Zealand, or Australia as the only options, and only if she decided to spend months and months doing nothing but studying to pass the boards.
Once we are getting closer to retirement, though, then we will start looking.
And rightly so, for they have been failed. You can’t even GO TO SCHOOL without concern that you’ll be killed in a mass shooting. This was never a concern for my generation. In 1992, when I graduated, the thought that going to school could be an extinction event for you was not even conceivable. This shouldn’t be an ongoing concern for any generation, yet here we are, sending our kids off to school every morning, knowing that there’s a slim chance they might not come back.
It’s driving me crazy. But when the whole world’s gone mad, how can you be sure you’re insane?
I graduated in 1997, in a rural town, and I can say that we’ve knives that caused some injuries and scares and while we did have a kid that brought his dad’s handgun to school and threatened people with it, didn’t shoot anyone thankfully. This type of shit was around even in the 90’s just not around the world and in the 24 hour news like it is now, remember we had Columbine just a few years after we graduated in 1999.
This shit’s been bad for a while now.
Yeah, but they’ve gone from rare occurrences to multiple-times-a-day events now.
https://ballotpedia.org/United_States_school_shootings_and_firearm_incidents,_1990-present
Don’t get me wrong, it’s been on a steady increase but cripes man, this crap is a “It was always burning since the world’s been turning” kind of a thing. I mean 32 in 1992, that’s not insignificant so let’s not pretend that all of this sunshine and roses until now.
It’s not surprising, the power structures keep deviating from the will of people in many cases, or use people as useful idiots for keeping assholes in power.
People like Trump have never won a popular vote in the U.S., and don’t win in the U.S. without gerrymandering.
Moreover, the poverty and misery of immigrants is often exploited to create a “beast” class of citizenry that is then used to create disgust and contempt in others, which is the formula being used in Europe. A lot of these power maintaining strategies are expertly crafted by Harvard/MIT/Ivy League educated sociopaths and psychopaths. People deserve better.
Most interesting to me is that these pissed off folks think this is something new. I remember feeling this way in 1968. And as you get older and realize you’re dying, guess what. You have to go through the stages of grief again.
Oh I thought it was because they like Trump, are Russian bots, and tankies. At least if people here are to be believed.
America fails it’s citizens in myriad ways. I very openly talk about that. I also know for a fact that all the shit you mentioned is absolutely all over Internet social spaces. It’s incredibly obvious.
What I see people here talking about most often is income inequality. I’m not sure why you didn’t bring that up.
One can simultaneously not like Trump, the US/NATO establishment, the CCP, Putin, Tankies, Republicans™, and Democrats™.
None of these cults and demagogues are friends to ordinary people.
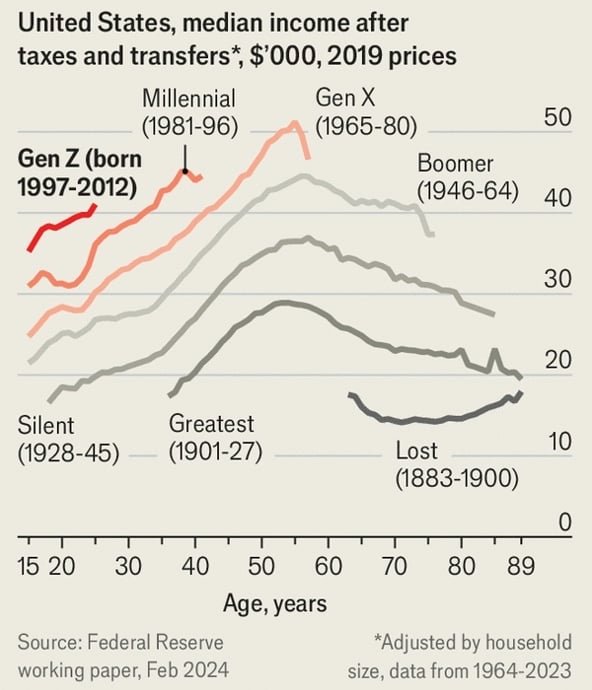
Each successive generation has a higher income even accounting for inflation
The study that graph is from literally says that millenial growth has stalled compared to baby boomer and silent generations:
https://www.federalreserve.gov/econres/feds/files/2024007pap.pdf
We confirm that there has been a slowdown in intergenerational progress, except for Millennials who saw their incomes grow slightly faster than Generation X but still more slowly than Baby Boomers and the Silent Generation. Intergenerational progress has remained positive for all generations.
First, we find that the higher household incomes of Millennials relative to Generation X, through their 20s, is a result of dependence on their parents rather than a rise in their own market incomes.
How do they calculate your household income when you can’t afford a household?
I think you’re being glib, but my assumption is they are using household in the IRS sense, I e. A household consists of any one taxpayer and whoever they can claim as dependents.
No, I honestly didn’t know. Thank you. So if more than one person lives in a house, if they are unrelated (i.e. roommates, no dependents) it’s more than one household?
Yes, for tax purposes, which then implies such a metric can be used for income reporting, as is this case with this chart. After all, if you and a platonic roommate were sharing an apartment, you probably wouldn’t want to include their income on your filings to the IRS. For one, the illegality of falsely claiming a dependent, but also simply because the last thing you want the government thinking is that you made more money than you actually did.
That makes sense. Thanks.
I didn’t realize that you were linking to the same paper I had found independently and is the source of the parent comment. The way they are calculating household income isn’t the same as the IRS.
Household income refers to total income received by all members of household, divided by the square root of the household.
It’s a wonky calculation.
That chart lacks context. The cost of living has drastically increased with each generation as well, far outpacing the increase in wages.
The cost of living is tracked by inflation, that’s what inflation is
It looks like there’s nothing I can say to make you see, but even accounting for inflation, the cost of living has been outpacing wages for decades! That’s why the average US worker in the 1950s could support a home with their wages alone, but today, two people working full-time jobs still can’t afford a home.
That’s because the cost of living has been outpacing wages.
But that’s only true in the 1970s and 1980s. In recent years wages have outpaced inflation
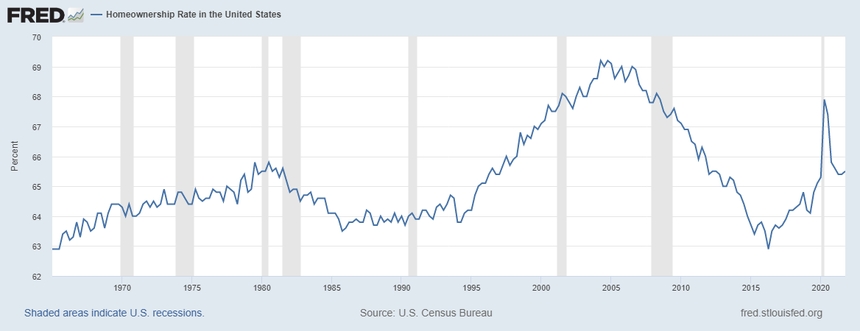
Why is home ownership now higher than before?
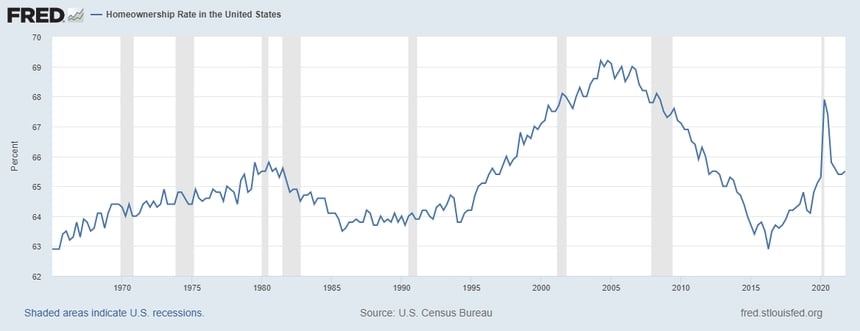
you keep reposting this shit graph even after it’s been pointed out that it’s meaningless…
Nobody actually addressed it, they just kept saying it’s bad without any argument. Why didn’t people buy homes in the 1960s?
deleted by creator
deleted by creator
Meaningless chart.
It doesn’t account for things like the median home price in 1950 being ~$7000 vs over $400,000 today. The chart doesn’t show a peak earning increase of 10x between the Silent Generation vs GenX, which seems to have done the best, albeit only briefly. Adjusting the average home price for CPI makes a ‘50s $7k home less than $100k today.
Home ownership right now is still pretty high
Just because it was cheaper doesn’t mean people could afford them
None of your charts say anything for first time home buyers. Total home ownership percentage is meaningless when you’re also trying to assert what you are about younger generations. My wage isn’t made any more livable because my grandparents bought a house in the 60s.
When you focus so hard on limited statistics your conclusions are similarly limited. Consider this: in 2022 the percentage of college educated people in the US actually went down from previous years. That’s never happened before because college has never been as unattainable as it is now. Unemployment rates are the lowest they’ve been in decades, but places like restaurants are being forced to close because they can’t fill low paying positions. Either young people are bound and determined to die penniless and uneducated, or there’s some problems you’re conveniently ignoring.
Here’s the source for that chart. And the paper for that chart.
The chart is for household income. With each generation, there’s an increase in the percentage of the generation living at home. This is noted in the paper, but not in The Economist article. We’ll see if Gen Z makes the switch like Millennials were during their 30s.
A couple of asides. The Economist graph isn’t very easily matched with one from the paper. There are several graphs that share similar contours, but The Economist has changed the aspect ratio enough that it’s hard to identify with visual inspection. Most curious, though, is The Economist’s choice of starting the x-axis at 15 years old. All the graphs in the paper start at 20myesrs old.
The conclusion in The Economist piece is as follows:
What does this wealth mean? It can seem as if millennials grew up thinking a job was a privilege, and acted accordingly. They are deferential to bosses and eager to please. Zoomers, by contrast, have grown up believing that a job is basically a right, meaning they have a different attitude to work. Last year Gen Z-ers boasted about “quiet quitting”, where they put in just enough effort not to be fired. Others talk of “bare minimum Monday”. The “girlboss” archetype, who seeks to wrestle corporate control away from domineering men, appeals to millennial women. Gen Z ones are more likely to discuss the idea of being “snail girls”, who take things slowly and prioritise self-care.
It is clear that The Economist has an agenda of dividing Millennials and Gen Z. The paper makes no claims about Gen Z and their economic outlook. The data is simply not there. Rather, The Economist is recapitulating tired themes of “the youth these days” and “kids don’t want to work”.
People work when they have something to work towards, with and for people they care about. People work hard because it fills us with meaning purpose. When we are young, we do and should be creating relationships and learning about ourselves, the world, who we wish to be in the world, and who we wish to journey with.
I forever will call bullshit on the anti-youth themes of our culture. It dimishes it and serves only the most well established and crumudgenly amongst us. Articles like these have all too obvious subtext of “shut up, work hard, and grow up”.
Fuck that noise.
Living at home doesn’t necessarily make you part is the same household. When I started paying for my dad’s electrical bills and he stopped filing me as a dependent, we became roommates, not part of the same household.
Read the original paper.
At the household level, intergenerational improvements in income are even clearer at all age ranges, including young adulthood. This is consistent with individuals increasingly living with and relying on their parents well into their 20s, although improvements from relying on parental resources do not reflect the same type of financial progress as improvements from one’s own income.
So you are saying that Millenials at their peak now are making as much as Boomers did 20 years ago when houses were about a quarter of the price, and somehow your conclusion is that Millenials are doing great? Or let’s look at age vs age: at age 40 a Millenial makes twice as much as a Boomer did at that age, but a Boomer at age 40 could buy a new house in a nice suburb for under $100k when that exact same house is over $300k now.
The chart is indexed for inflation. Housing went up faster, but things like fuel are not so expensive comparatively
You’re cherry picking things that went up faster
By the way, home ownership rate:
It’s not lower now
The CPI used for that doesn’t distinguish between generations so the lower house prices from people who got their houses in the 1990s are going to be mixed with the higher house prices of those trying to get their houses now with the former dilluting the latter.
Further the inflation index doesn’t reflect a lowering utility value of houses: if dwellings further and furthe taway from the places of work are built and occupied because people are been pushed further out by higher prices, so the utility of the houeses is lowet, that is not reflected in the CPI (at most it makes it a bit lower than it should be since the expanding pool of lower utility houses pulls the average price down a bit).
Further, as others pointed out, younger people are staying in their parents for longer and longer AND delaying childbirth, so their available income is higher because they’re not spending any money in housing or children.
The numbers not only do not reflect a better life, they’re not even comparable in their own merits across generations because the personal inflation of somebody looking for a place to live now is totally different from the one of those who have been living in a house they bought 30 years ago.
That’s a valid criticism, but most mortgages are 30 years, so anyone who bought a house in 1994 is paying their last payments on it.
People like my dad who bought houses during the 2000s didn’t get a good deal. Sure, it still eventually appreciated, but it’s not an outrageously good deal compared to getting a house just a few years later
That said, it’s getting better in places that build new housing
At least this one explaothe y axis…
Yeah but it doesn’t tell the whole truth, cost of living has been rising steadily as well.
Cost of living is inflation, which this chart takes into account
Sure, but inflation doesn’t factor in price hikes, for instance medical insurance, drug prices, house prices, rent, collage tuition or new expenditures that didn’t exist 20 years ago. These don’t follow the curve of inflation, they are artificialy inflated which is shown in increased profit margins.
Rent is literally a third of inflation calculation
How do you complain it doesn’t factor it when it’s the biggest contributor?
Dude, I’m not complaining I’m giving you examples of things that they don’t account for. Rent is different, you have landlords jacking the price to an extreme, and then you have those who follow the inflation curve. It’s just dishonest.
That list is wrong because they do account for those things
Repeat same talking point.
The things you say are useless, especially since these are adjusted by household size. Do one that isn’t.
Repeat same talking point.
I’m not saying I agree with them, but they are the only ones providing actual data. Everyone else, including you, is just attacking and downvoting them. I would be interested in hearing an actual argument, but to accuse them of just “repeating a talking point” while they provide data and you provide nothing but a talking point is ridiculously hypocritical.
Their data is adjusted for family size. Family size has been consistently shrinking since the 1960s, which, if you adjust their graph, will lead to overall decrease in wages throughout time. It is a meaningless method of transformation to get data that supports a false narrative.
Why did you not point out that their data is transformed when I did?
You still haven’t provided any actual data. Again, you just hand wave it away.
I’m not saying you’re wrong, I tend to believe you are right in fact, but if you can’t be arsed to actually defend your position - that’s fine - but its then hypocritical to claim the other person just repeating a talking point.
I wonder what happens to this chart if you remove the top 1% from the calculations. “Median” basically means halfway between the top and bottom… The massive and increasing wealth gap means this graph is basically worthless.
Shhhh that completely undermines their point.
If you remove 1% it will be showing the 51st percentile instead of the 50th…
And people can’t afford houses, college, healthcare, etc. because…? Like cool chart, but my generation will literally never be as financially stable as those who came before. I guess it’s fun to pretend we’re better off than we are though.
Imagine paying for college with your income rather than loans.
People can afford more things now than the previous generation
There are things that increased in price faster, like college. But that’s offset by other things that didn’t increase as fast, like fuel. There are other things that got cheaper, like computers and phones. You’re cherry picking the things that got more expensive, but those are not 100% of a person’s expenses
You’re missing the whole point. Think about it another way: You listed things that go down in value or get used up. They listed things that appreciate in value and build wealth.
You’re comparing (barely) being able to afford the cheap iPhones and gas to an education and homeownership.
Those things still cost money and you still need them.
If food prices didn’t go up as fast as housing, and you say “housing builds wealth and food gets used up” which is true, but you need to eat to live. Food not going up so fast is a good thing.
Housing building wealth is a bad thing. Houses should go down in value, we should be building so many that old houses should be worth less than me ones, like they do in Japan
It’s fun that tvs and computers got cheaper, but housing and food are through the roof.
It’s cool that I can buy a laptop for 500$ dollars, but it’s a one time purchase that we can live without.
Food is not through the roof
https://tradingeconomics.com/united-states/food-inflation
2.2% vs. the previous year
Yeah and look 2 years back on your same graph and see the big 11% in one month.
And let’s not forget that this is multiplicative. So these months/years with high inflation are still felt today even if the inflation is relatively normal.
But you are disingenuous in your arguments, while accusing others of doing that same thing.
So kindly fuck off
That’s in line with the inflation numbers. Food costs did not outpace inflation in any significant way
When you can’t make rent but at least you’ll have the newest iPhone in your cardboard box… how is this a win?
Yet still workings are still making less than they should.

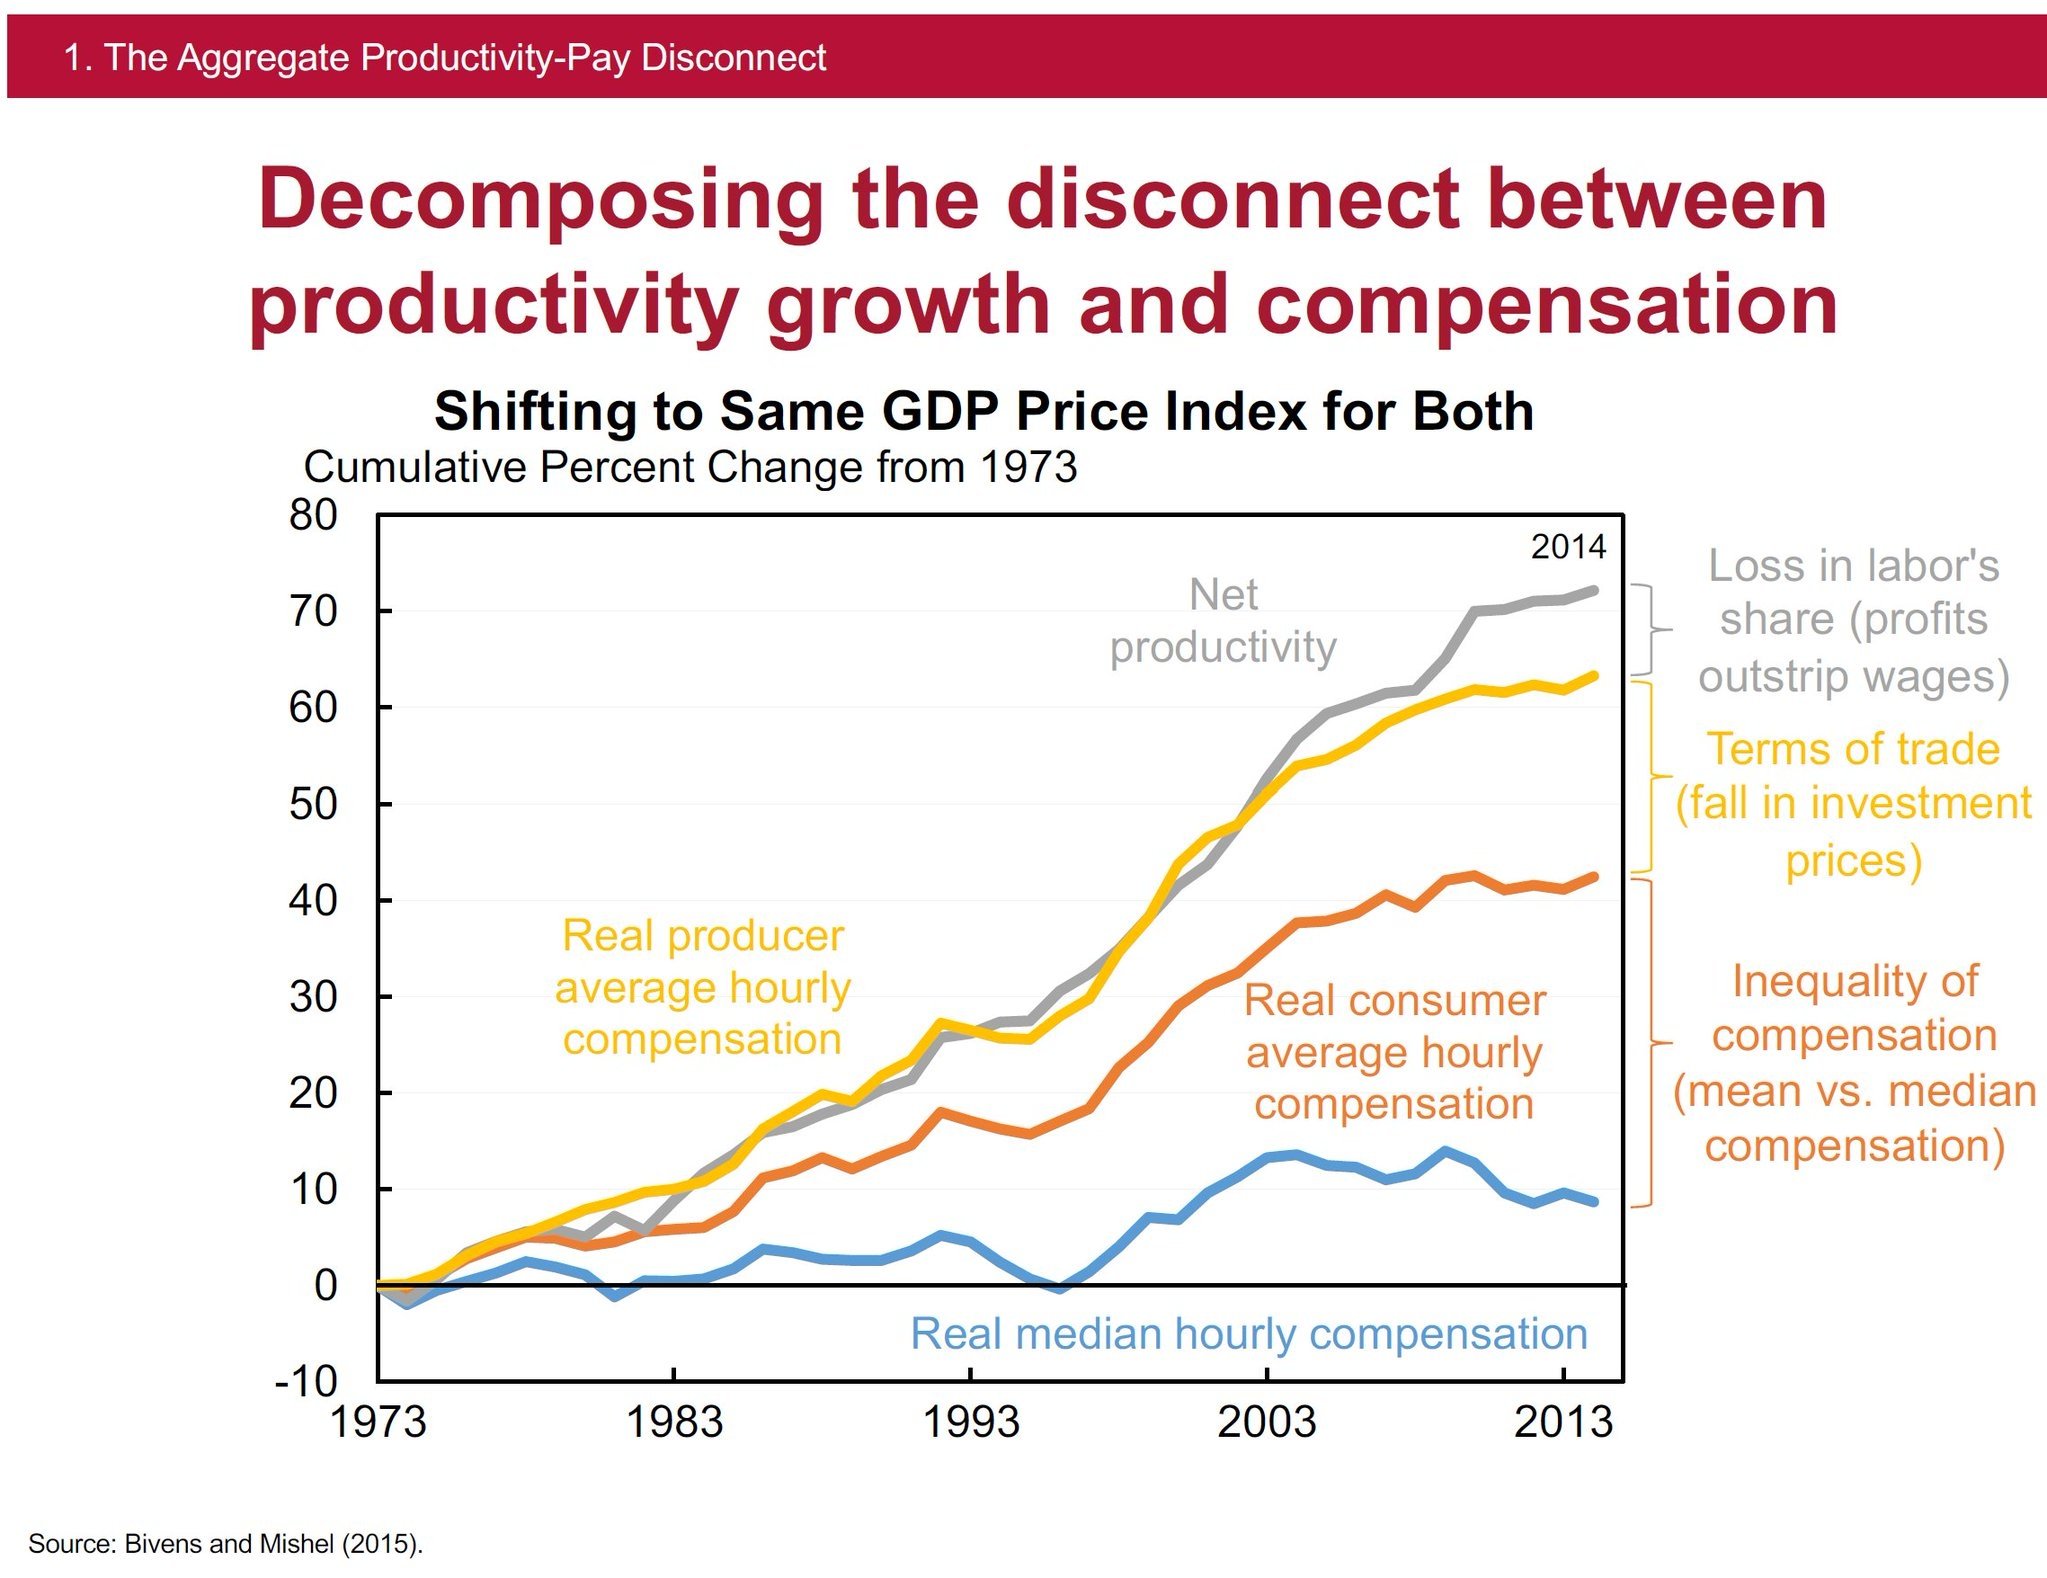
It’s a deliberately misleading chart, especially using median salary and mean productivity
God I just don’t have the energy to explain Mean, Median and Mode right now. But it is not misleading Median is much better than Mean when your data has outliers such as a few high earners that skew the data. But let’s face it you don’t care do you or you would know this already.
Yes, but the productivity is using the mean, not the median which is why that chart is flawed
Okay now do one that shows how much is available after paying for things like rent, food, car, etc.
Meaningless chart
That’s been done too
https://home.treasury.gov/news/featured-stories/the-purchasing-power-of-american-households
Purchasing power of American households is at all time high
Okay, now why hasn’t the minimum wage been raised in literal decades?
Honestly it just seems like you’re being obtuse
That’s the federal minimum wage, cities have certainly raised their own minimum wages
That’s why only like 1% of workers make the federal minimum wage
Nice cherry picking, you got any other fallacies to throw in there?
1% of workers is not very impactful for the average income
The workers who make $20 minimum wage in SF are not affected by $7.25 minimum wage
In 1960, minimum wage was $1.00/hour and the price of the average US home was $11,000.00
How many minimum wage workers are out there right now looking to buy a new home?
They weren’t buying then either
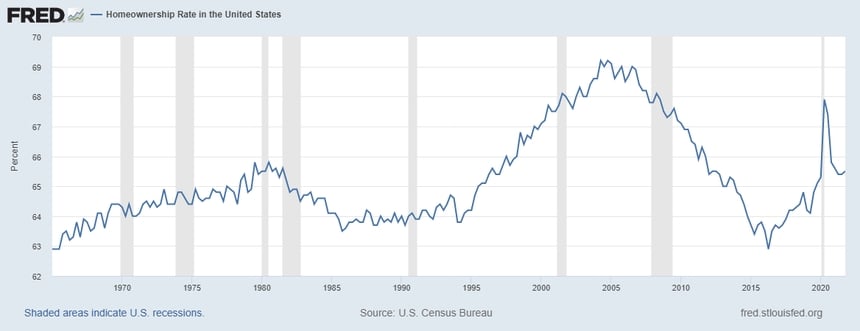
So, you agree, people were able to buy a house on minimum wage in the past and can’t do that today?
They were not, look at ownership rate.
You’re deliberately ignoring what I actually wrote. Two high school grads working minimum wage jobs in 1960 could have been homeowners in about five years. There are hundreds of reasons why the ownership rate was lower in the past.
Could have been, but did not buy homes. Explain why
Missing some really important variables, there (inflation, buying power, etc)… while using metrics that present an a deliberately inaccurate picture (median rather than average, and not adjusted for outliers).
Basically, this chart is useless, deceptive propaganda.
It’s inflation adjusted
If it used the mean you’d complain about that too, since it’s higher than the median. The median already completely throws out any outliers. That’s why it’s lower than the median because the distribution is right skew
Sure Bud, nice meaningless chart.
I’m not your Bud, friend
Your use of ancient reddit memes doesn’t make your chart meaningful.
Christ, it’s not a reddit meme. It’s a south park reference
It’s a South Park quote, nothing to do with Reddit
Gen-x’ers have been dealing with this forever. Nothing new.
“It’s not just that I have a lot, it’s that I have more than everyone else. Forever.”
“Just” doing a lot of heavy lifting here


